Analysis of the electrical connector separating force by linear model
1. Introduction
1.1 question description and background
In this article, the focus is how connector type and angle of pull influence the force needed to separate connectors. If the electrical connectors require different amounts of force to disconnect, it may cause instability to the vehicle. For this reason, we want to examine the effect of the two factors and interaction between them and to find a most suitable connector .
1.2 the source and representation of data
The data is obtained from an experiment where five types of connectors(A, B, C, D and E) are examined at three angle of pull(0°,2°,and 4°). The independent variable “angle of pull” is numerical variable, while the independent variable “connector type” is string variable, it’s needed to be redefined. The exchange is shown in table 1.
Table 1 the representation of variable “connector type”
Type | A | B | C | D | E |
Type* | 1 | 2 | 3 | 4 | 5 |
2. Modeling and analysis
2.1 statistical method account
Note that in the experiment there are two influential factors, multi-linear regression model is used to find the relation between response variable and independent variables. In addition, there is also the possibility that the interaction between two independent variables is significant.
2.2 the influence of each variable and the interaction between them
Firstly, by an interaction plot, the effects of the two classifications and any interaction between them are provided. There are two possible interaction plots, showing the changing tendency as one variable when another is given (Tay and Lim, 2009).
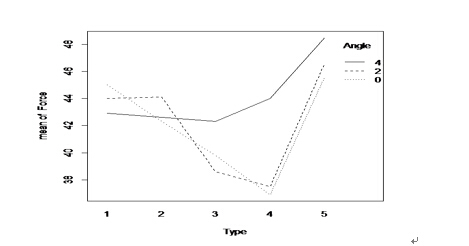
Figure 2-1 interaction plot for separating force when Type enters first
Figure 2-1 shows that from 1-4 of the variable “Type”, there is a descend tendency, while form 4-5, the lines ascend abruptly. It’s hard to explain this phenomenon with a multi-linear regression model. For solving this problem, the order of 1-5 representing A-E is changed (Richard et al., 1988). Note that the values when Type is 5 are higher than when Type is 1 to 4, type E is placed at the first place. The representation changed is shown in table 1*. The changed interaction plot of figure 2-1 is repotted in figure 2-1*
Table 1* the changed representation of variable “connector type”
Type | A | B | C | D | E |
Type* | 2 | 3 | 4 | 5 | 1 |

Figure 2-1* changed interaction plot for separating force when Type enters first

Figure 2-2 interaction plot for separating force when Angle enters first
From figure 2-1*, it’s evident that connector type and separating force has linear relation. The plots in figure 2-1* and 2-2 suggest that both Type and Angle have substantial effects on the response. Since the lines on each plot are not parallel at all, there is significant evidence of interaction between the two variables.
2.3 multi-linear model and significance test
A non-additive model (Anderson, 1984) (where interaction between the variables are considered) is obtained by R commands (Venables et al,. 2008). The termrepresent the estimation of separating force.,Type, Angle and the interaction Type: Angle.
![]()
To examine the significance of this regression model, an analysis of variance for the separating force against connector type and angle of pull and t test of each parameter give the tables in the R output below.
Table 2-1 analysis of variance for force against type and angle
Df | Sum Sq | Mean Sq | F value | Pr(>F) | |
Type | 1 | 103.788 | 103.788 | 37.4682 | <0.0001 |
Angle | 1 | 11.449 | 11.449 | 4.1332 | 0.0669 |
Type: Angle | 1 | 8.45 | 8.45 | 3.0505 | 0.1085 |
Residuals | 11 | 30.47 | 2.77 |
Table 2-2 results of t-test
Coefficients: | Estimate | Std.Error | t value | Pr(>|t|) |
(Intercept) | 49.1733 | 1.5935 | 3.09E+01 | <0.0001 |
Type | -2.51 | 0.4805 | -5.224 | <0.001 |
Angle | -0.44 | 0.6172 | -0.713 | 0.490725 |
Type: Angle | 0.325 | 0.1861 | 1.747 | 0.108537 |
From table 2-1, there is strong evidence of the influence of Type, as well as some evidence of the influence of Angle and the interaction effect of the two factors (John, 1995). However, table 2-2 suggests that the P-value of Angle is too big. The coefficient of Angle is not significant (Bilodeau, 1999). It can be explained from figure 2-2. For different connector type, the changing tendency is quite different, some descend, some ascend and others have no obvious tendency as the angle of pull increases. It’s more efficient to separate different type connectors and focus on a certain type to examine the effect of angle of pull. It’s discussed in next section (Liang, 2007). Table 2-2 also shows that the interaction effect can not be omitted, for it’s P-value is small enough. From figure 2-1* and 2-2, the lines are not parallel which is the effect of interaction.
2.4 stabilities of the connectors
A connector is considered more stable if the separating force changes small as the angle of pull changes. In this section, the effect of angle of pull is examined with separated types of connectors (Chen, et al., 2011). Slope of Angle means the coefficient of the factor Angle. It can suggest the stability of each connector type. The bigger the absolute value of the slope is, the more instable this connector type is.
Table 2-3 coefficients of Angle and P-value of the coefficients
Type | 2 | 3 | 4 | 5 | 1 |
slope of Angle | -0.525 | 0.075 | 0.625 | 1.775 | 0.725 |
P-value | 0.017498 | 0.9006 | 0.5393 | 0.2848 | 0.1129 |
Type 3(B) is more stable, so more suitable from the result shown in table 2-3 (Crowder, 1990). The problem is that their P-values suggest that the estimation has big error. Most coefficients are not significant. That’s because there are only 3 items of data for each regression model.
3. Conclusion
1.1 From interaction plots, both Type and Angle have substantial effects on the response. In addition, the interaction of the two factors has evident influence on response cause the lines in each interaction plot are not parallel.
3.2 Multi-linear regression model is as follows: The term![]() represent the estimation of separating force.,
represent the estimation of separating force.,![]() Type,
Type, ![]() Angle and
Angle and ![]() the interaction Type: Angle.
the interaction Type: Angle.
![]()
The significance test suggest that the coefficient of ![]() is significant and that of
is significant and that of ![]() is significant in 0.1 confident degree, while that of
is significant in 0.1 confident degree, while that of ![]() is not significant. Multiple R-square is 0.8023, Adjusted R-square is 0.7484. It means that this model can explain most information in the data.
is not significant. Multiple R-square is 0.8023, Adjusted R-square is 0.7484. It means that this model can explain most information in the data.
1.3 A rough conclusion drawn that Type 3(B) is more suitable because the separating force it needs varies less than other types. If a more credible result is wanted, more higher level statistical method should be carried out and more experiment data should be collected (Hamersley & Handscomb, 1966).
References:
Anderson T. W., (1984) ‘An Introduction to Multivariate Statistical Analysis.’ Third edition. New York : John Wiley & Sons Inc.
Bilodeau, M & Brenner D. (1999) ‘Theory of Multivariate Statistics. ’ Springer-Verlag New YorkInc.
Chen, W. H., Liu J., Gao L., PAN J., and Zhou S. J. (2011) ‘Accelerated Degradation Reliability Modeling and Test Data Statistical Analysis of Aerospace Electrical Connector, ’ Chinese Journal of Mechanical Engineering, 24:957-964.
Crowder, M. J. & Hand, D.J.(1990) ‘Analysis of repeated measures. ’ Journal of Statistical Planning and Inference, 32: 417-418.
 美国高中作业代写:历史,留学生代写,高中essay代写丨GDEssay论文网
 新西兰论文代写:市场营销,新西兰代写essay
 澳洲代写paper:市场营销策略,澳洲代写essay,悉尼代写
 新西兰代写assignment:商业经济,留学生essay代写,作业代写委托,GDEssay代写网